How to Tell if Zinc Oxide Is Nano or Non-Nano
Analytical Strategies for Particle-Size Verification Using SEM, DLS, BET, and XRD
Zinc oxide (ZnO) has been known for decades as a versatile compound for use in sunscreens and cosmetics as well as industrial catalysts and ceramics. More recently, the advent of nanotechnology research has increased the use of ‘nano-ZnO’ due to the drastically higher surface energies associated with particle sizes less than 100 nm.
As of late, it has become necessary for organizations such as the EU’s REACH initiative and the US FDA to establish clear definitions of ‘nano’ and ‘nonnano’ forms of such compounds, particularly as nanomaterials may act quite differently in biological and environmental settings. Establishing the ‘nano’ status of a given ZnO sample thus underscores the need for high-quality analysis.
This article explains how to determine if a zinc oxide sample is nano- or non-nano using the principal analytical techniques: scanning electron microscopy (SEM), dynamic light scattering (DLS), Brunauer–Emmett–Teller (BET) surface-area analysis, and X-ray diffraction crystallite-size estimation (XRD/XRDC). Each method provides complementary information about size, morphology, and aggregation, and together they yield a defensible classification consistent with international standards such as ISO/TR 13014 and OECD guidelines.
1) Understanding the Meaning of ‘Nano’
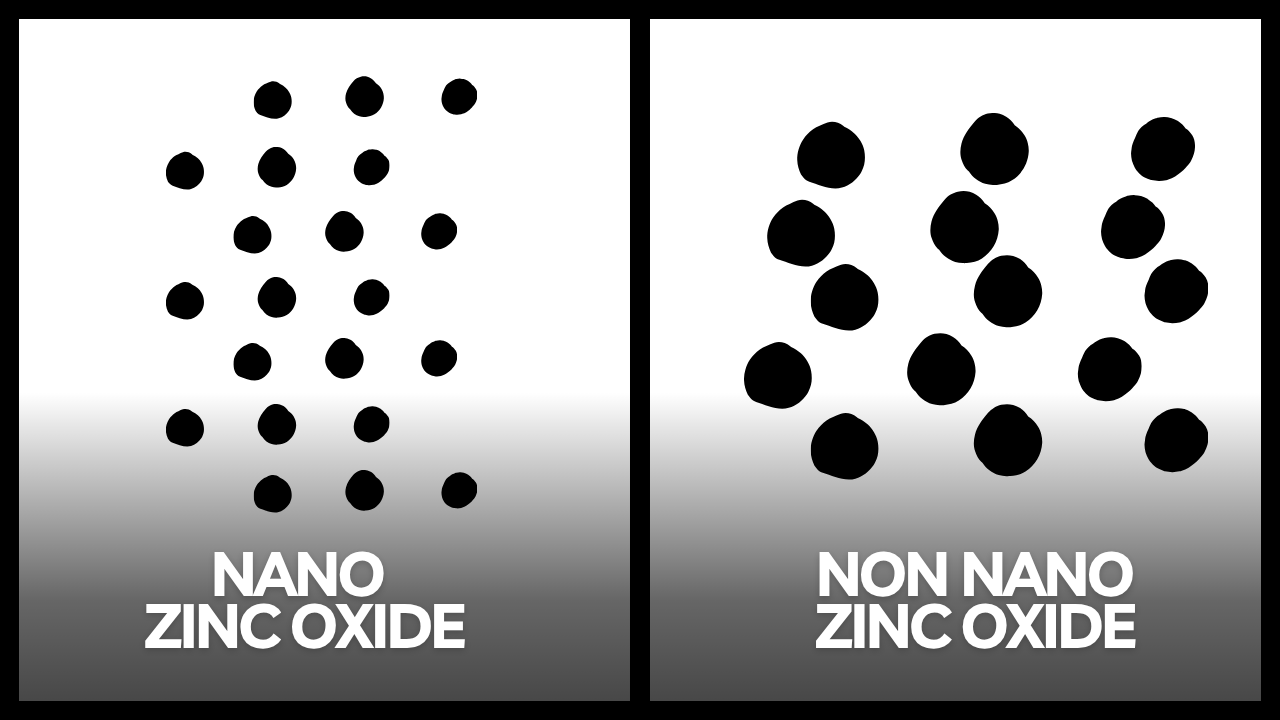
The European Commission states that a nanomaterial is a natural, incidentally produced, or artificial material consisting of particles that are unbound or aggregated/handled as aggregates, and where 50 % or more of these particles have at least one externally measured dimension in the size range 1 – 100 nm. Non-nano or microsize ZnO powders have particle diameters from several hundred nanometers to a few micrometers.
However, ZnO can form aggregates consisting of loosely bound groups of primary crystallites held together by van der Waals forces. These aggregates may have sizes much larger than 100 nm despite having crystallite sizes on the nanoscale. Hence, it is essential to distinguish size based on primary crystallites and aggregates. Current analysis techniques cannot serve the purpose due to the complexity of size determination.
2) Scanning Electron Microscopy (SEM): Visualizing Particle Morphology
Principle and Application:
In SEM, a focused electron beam is used to create images of the surface with nanometer resolution. The collected secondary or backscattered electrons produce images that reflect the proper shapes of ZnO particles, whether spherical, rod-shaped, hexagonal, or plate-like..
Sample Preparation:
The ZnO powder is usually suspended on conductive carbon tape supports, with a thin gold or platinum film coating to avoid charging. The careful suspension of the powder prevents particle overlaps and enables the determination of particle size from primary particles.
Interpretation
High-resolution micrographs can be used to determine the size of individual particles by using image analysis software such as ImageJ. The particle size should be below 100 nm. If that’s the case, then it’s nano-ZnO. Also, SEM analysis can determine particle aggregation, surface roughness, and porosity.
SEM provides direct visualization of particle size, shape, and surface detail, but lacks robust statistical sampling capabilities and may be affected by artifacts from sample preparation or aggregation. Usually, nano-ZnO exhibits 20-80 nm-sized hexagonal crystallite aggregates, as opposed to smooth micron-sized grains of non-nano powders. As such, SEM micrographs are typically included in official documentation for nanomaterial size determination.
3) Dynamic Light Scattering (DLS): Hydrodynamic Diameter Measurement
Assumption and Implementation:
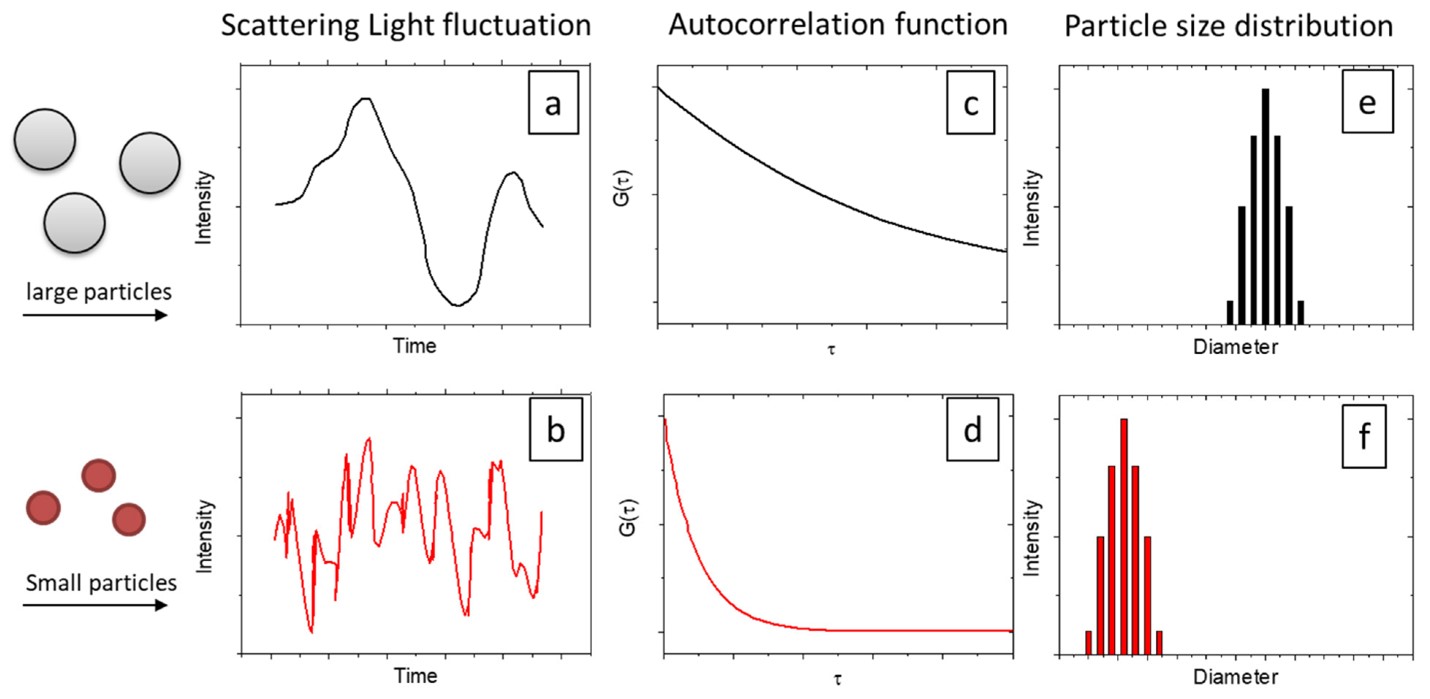
DLS measures particle size by analyzing fluctuations in scattered laser light caused by Brownian motion. The diffusion coefficient DDD of a particle can be derived from the Stokes–Einstein equation.
Since ZnO particles tend to form aggregates in liquid solutions, DLS yields particle sizes rather than individual crystallite sizes.
Sample Preparation:
Use ultrasonics to disperse ZnO in a low-ionic-strength solvent, such as ethanol or water, at pH 7-8. Surfactants should not be used as dispersants. These could introduce bias into the data.
Interpretation
Based on intensity-weighted DLS data, a strong peak below 100 nm and a polydispersity index below 0.3 indicate a predominantly nanoscale suspension. Peaks that are wider and above 200 nm indicate aggregation or non-nano suspensions.
DLS: a rapid and non-destructive technique that works perfectly on dispersion solutions. However, it’s affected by aggregation, considers only spherical particles, and cannot handle dry powder. DLS helps to supplement microscopy techniques such as SEM..
4) BET Surface-Area Analysis: Linking Surface Area to Equivalent Particle Size
Principle
The Brunauer–Emmett–Teller (BET) method determines the quantity of nitrogen gas adsorbed on a material’s surface at cryogenic temperatures. You can turn the specific surface area (m²/g⁻¹) into an equivalent particle diameter if you know the density and that the particles are not porous and are spherical in shape.
dBET = 6/pS
Where dBET = mean particle diameter, p = density (for ZnO ≈ 5.61 g cm⁻³), and S = BET surface area.
Interpretation:
The BET surface areas of nano-ZnO (20–50 nm) are usually 20–50 m²/g⁻¹ or higher, while the BET surface areas of micron-sized ZnO are less than 5 m²/g⁻¹. So, a large surface area supports nanoscale classification even when direct imaging is difficult.
The BET method provides a reliable bulk-average over a large sample mass and is not affected by particle agglomeration, making it useful for measuring overall surface area. But it only works with smooth, non-porous particles and can’t distinguish between internal pores and external surfaces, so it’s not a direct measure of particle size. For regulatory reasons, BET analysis is often used in conjunction with SEM to ensure that particle sizes determined by surface area match the shapes observed.
5) X-Ray Diffraction (XRD/XRDC): Estimating Crystallite Size
Principle:
Powder X-ray diffraction determines the crystal structure of ZnO (usually hexagonal wurtzite) and enables the estimation of crystallite size from peak broadening via the Scherrer equation.
D = Κλ/βcos θ
Where D = mean crystallite size, K ≈ 0.9 (shape factor), λ = X-ray wavelength, β = full width at half maximum (radians), and θ = Bragg angle.
Interpretation:
Broad diffraction peaks are linked to small coherent domains. A (101) reflection with β ≈ 0.15° at 2θ = 36° yields D = 35 nm. This means that, even when they are grouped, individual ZnO crystals remain nanoscale.
X-ray diffraction (XRD) has both pros and cons. It is a widely used, non-destructive method that provides valuable information on crystallite size and phase purity. But it only measures coherent crystalline domains, not aggregate size, and it can’t show particle shape or surface morphology. When advanced methods such as Rietveld refinement or high-resolution analysis are used to obtain more accurate size-strain correlations, the term XRDC (X-ray diffraction crystallography) is often used.

6) Combining Multiple Techniques: A Decision Framework
A multi-method approach is necessary to accurately determine whether ZnO is nano or non-nano, as each analytical tool examines a different aspect of particle size. The general workflow starts with SEM to analyze morphology and estimate the size of the primary particles. Then, XRD/XRDC is used to confirm crystallite size and to detect nanoscale domains.
Next, a BET analysis is used to determine the relationship between surface area and the equivalent particle diameter. DLS is then used to determine the hydrodynamic size in relevant media, such as sunscreen formulations. If two independent methods, typically SEM and XRD, indicate particle sizes below 100 nm, the material is called nano-ZnO. If all measured sizes are above 100 nm and the BET surface area is low, the material is called non-nano ZnO.
Example classification:
| Technique | Parameter | Typical Nano-ZnO | Typical Non-Nano ZnO |
| SEM | Primary particle size | 20–80 nm | 200 nm–5 µm |
| DLS | Hydrodynamic size | 50–150 nm | > 500 nm |
| BET | Surface area | 20–60 m² g⁻¹ | 1–5 m² g⁻¹ |
| XRD | Crystallite size | 20–60 nm | > 150 nm |
Using these thresholds enables laboratories to report quantitative evidence in compliance with ISO 9276 (particle-size analysis).
7) Emerging Techniques
There are now new analytical tools that are improving the classification of ZnO size beyond the four classic methods:
- Transmission Electron Microscopy (TEM): Gives very high resolution for lattice fringes and exact crystallite boundaries.
- Small-Angle X-ray Scattering (SAXS): Gives the Ensemble particle-size distribution in situ, which works well with DLS.
- AFM (Atomic Force Microscopy): Good for measuring the thickness of coatings and the roughness of surfaces in films.
- Raman and Photoluminescence Spectroscopy: These techniques indirectly look into quantum-confinement effects, which only happen at the nanoscale level.
These advanced methods add to the evidence base when the material is close to the 100 nm limit.
Conclusion
To find out if zinc oxide is nano or not, you can’t just look at it or read the marketing description. You need to use a combination of validated analytical measurements. SEM shows the right shape and size of the primary particles; DLS shows how the particles are dispersed; BET measures the surface area in relation to the particle size; and XRD/XRDC shows the size of the crystallites. When viewed together, these methods provide a clear picture that aligns with international definitions of nanomaterials.
For formulators, researchers, and regulators, this level of detail is necessary to ensure that products are safe, perform consistently, and comply with evolving rules for nanomaterials. If your ZnO has crystallites smaller than 100 nm under SEM and XRD, a high BET surface area, and DLS peaks smaller than 200 nm, then you have true nano-zinc oxide. If not, it is still non-nano, which means it behaves, looks, and is classified as bulk.